
A functional overview of the Customer Receivables Analytics report.
Every business owner knows the feeling: sales are up, invoices are going out, and yet cash feels tight. The usual culprit is not what you sell but how quickly, and how reliably, your customers pay. Most finance teams can tell you today's total receivables. Far fewer can tell you whether a given customer is paying faster or slower than six months ago, or which accounts are quietly drifting towards trouble.
The Customer Receivables Analytics report in Power BI was built to answer exactly that. It turns your customer ledger and periodic receivables snapshots into one set of pages that show where you stand, where each customer is heading, and where to focus your collection effort this week.
This post walks through what the report shows, how to read it, and how to build it into a routine, without needing to touch a formula.
A customer owing 100,000 could be a reliable account that always settles within 30 days, or a slow payer whose balance has been creeping up for a year. A single balance figure cannot tell them apart. Trends can.
The report therefore looks at each customer's average balance across several time windows (1, 3, 6, 12 and 24 months) and compares the most recent picture with the longer history. It then layers on invoicing, payments, overdue amounts and collection speed. The result is a view of direction, not just position.
Everyone works from the same data, so the conversation between finance and management starts from shared facts.
The report has six pages. Each page has filters for Customer, Date and Periods (weekly or monthly snapshots), so you can move from the whole portfolio to a single account in a click.
The report is fed by the receivables log that the Acumens Receivables & Collections Management app creates in Business Central. Power BI reads that log and combine it with your customer ledger entries.
Each log run records, for every customer, the average balances over 1, 3, 6, 12 and 24 months, along with days to pay, days sales outstanding (DSO) and activity status. The ledger entries supply invoices, payments and open balances. Logs are run weekly or monthly, which is what the Periods filter on the report selects.
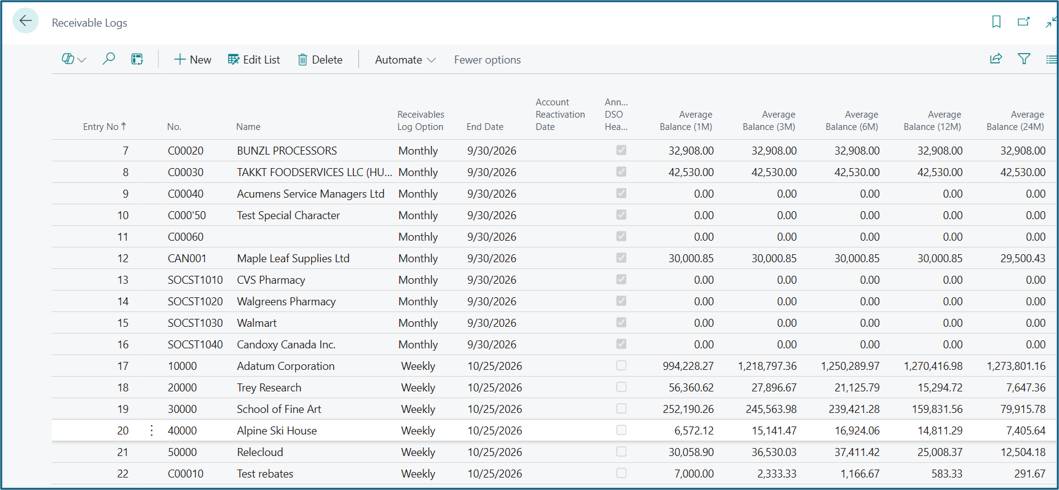
The Receivable Logs page in Business Central: one row per customer per log run.
This page counts your total and active customers and breaks them down by status (Prospect, Active, Current, Inactive), by rating (Excellent through High Risk) and by type (Company or Person). A ranked list shows which customers hold the largest outstanding balances.
What it tells you: how healthy the customer base is overall, and which accounts deserve attention first. A large balance sitting with a customer rated Weak or High Risk is your most urgent conversation.
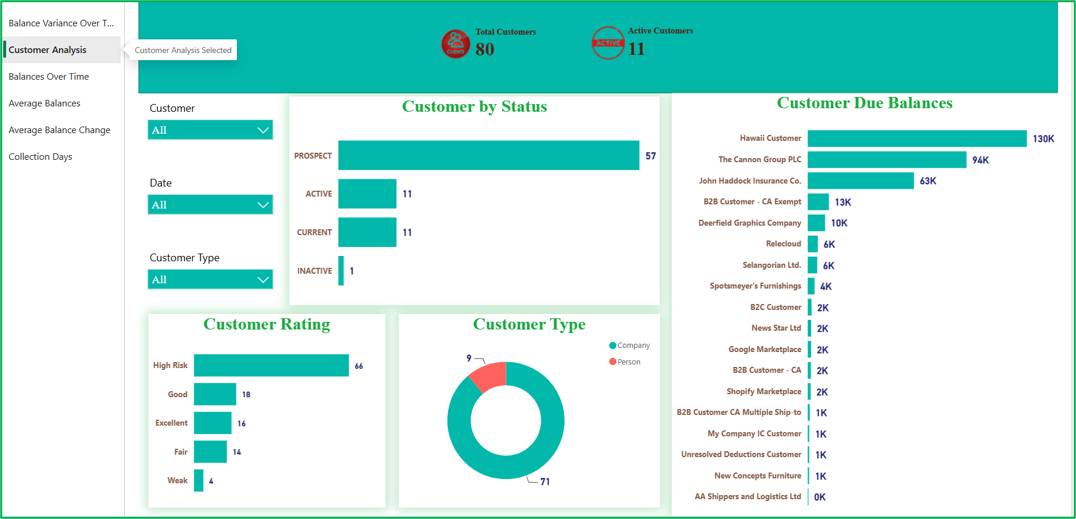
Figure 1 — Customer Analysis
This page compares each customer's most recent average balance with their 3, 6, 12 and 24-month averages, and shows the change as a percentage. A short narrative summarizes the pattern, and a customer table lists each account with its variance and its Customer Rating.
What it tells you: which customers are moving the right way, and which are lagging the average. Because it compares a customer with their own history, it highlights change even when the balance itself looks modest.
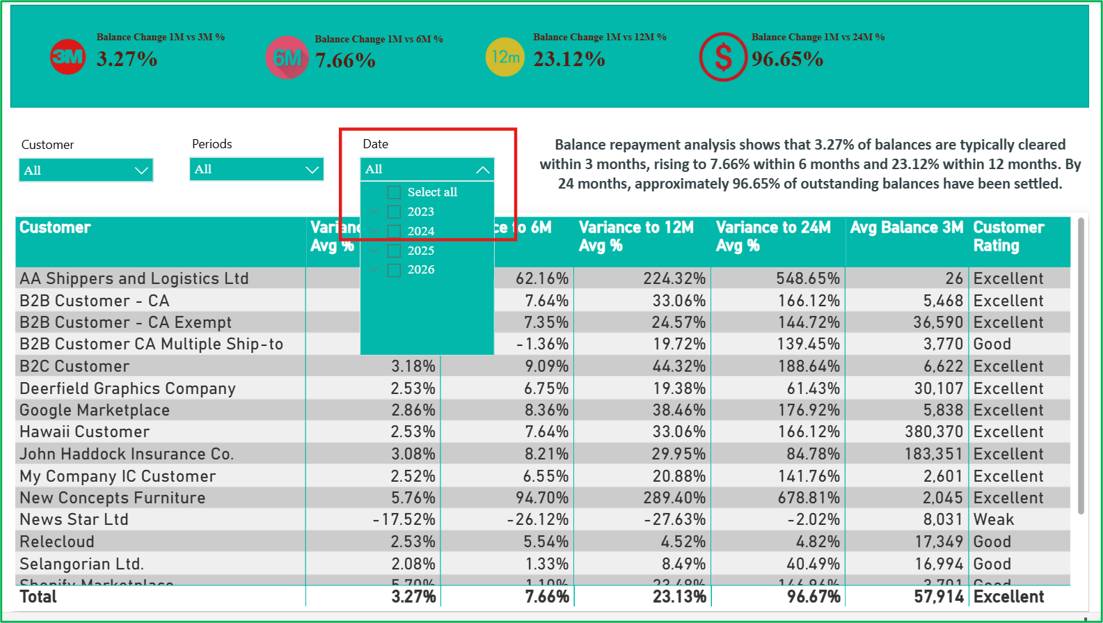
Figure 2 — Balance Variance Over Time
You see invoice amount, payment amount, outstanding balance, overdue balance and the payment ratio (payments as a share of invoices), together with monthly trends of outstanding balance and a year-by-year comparison of invoices against payments.
What it tells you: whether cash collected is keeping pace with what you bill. A widening gap between invoices and payments, or a spike in outstanding balance in a particular month, is an early warning worth investigating.
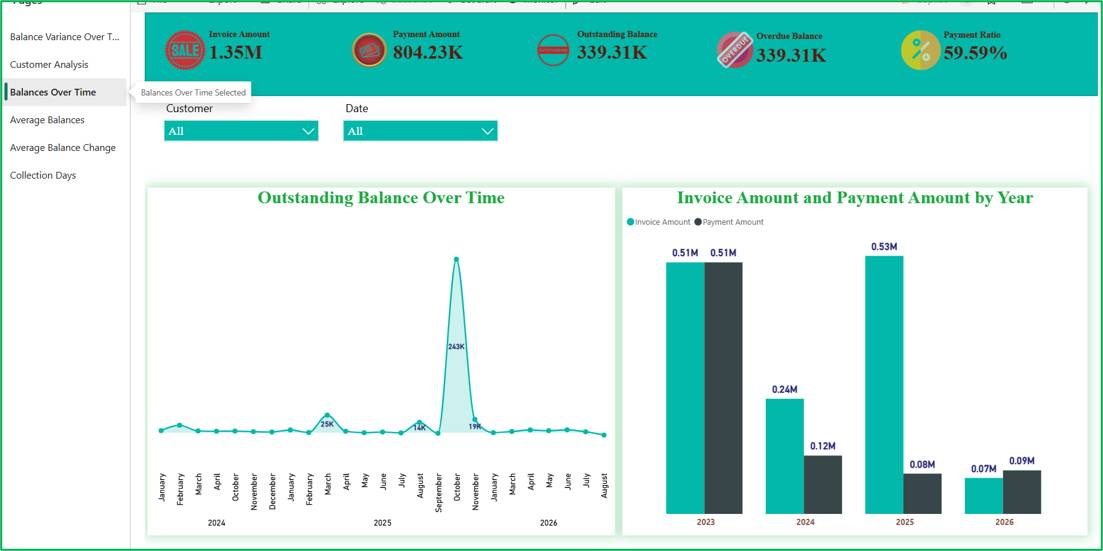
Figure 3 — Balances Over Time
This page plots the 1, 3, 6, 12 and 24-month average balances over time, monthly by default. Filter to one customer and you can watch their balanced behavior evolve.
What it tells you: whether average balances across the portfolio, or for a key account, are trending up or down.
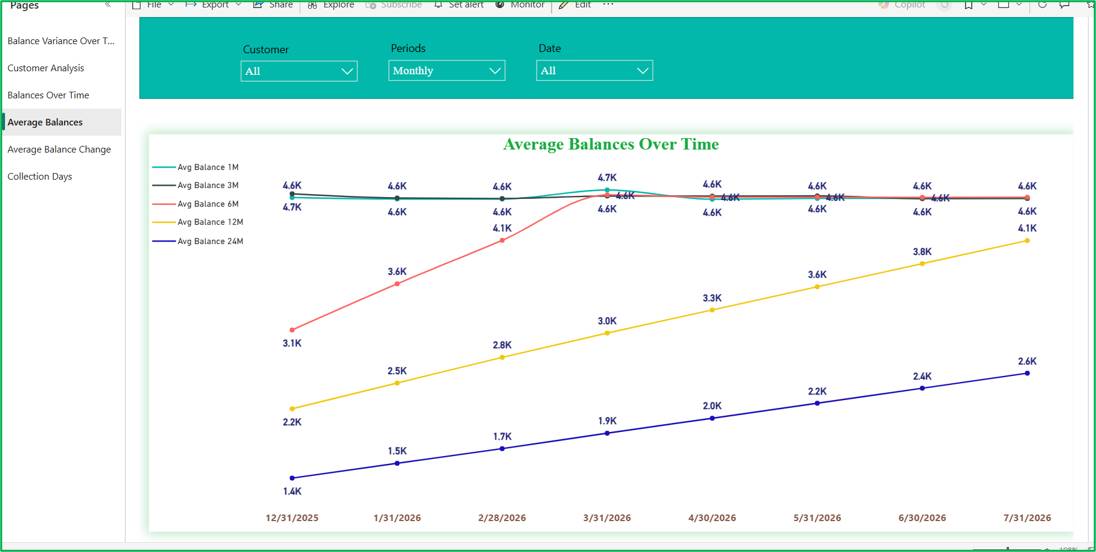
Figure 4 — Average Balances
The same five averages appear in a single comparison chart, with a plain-language summary. Seeing the short and long windows together makes the direction obvious at a glance.
What it tells you: whether customers are steadily reducing what they owe overtime, which is a positive sign for collections.
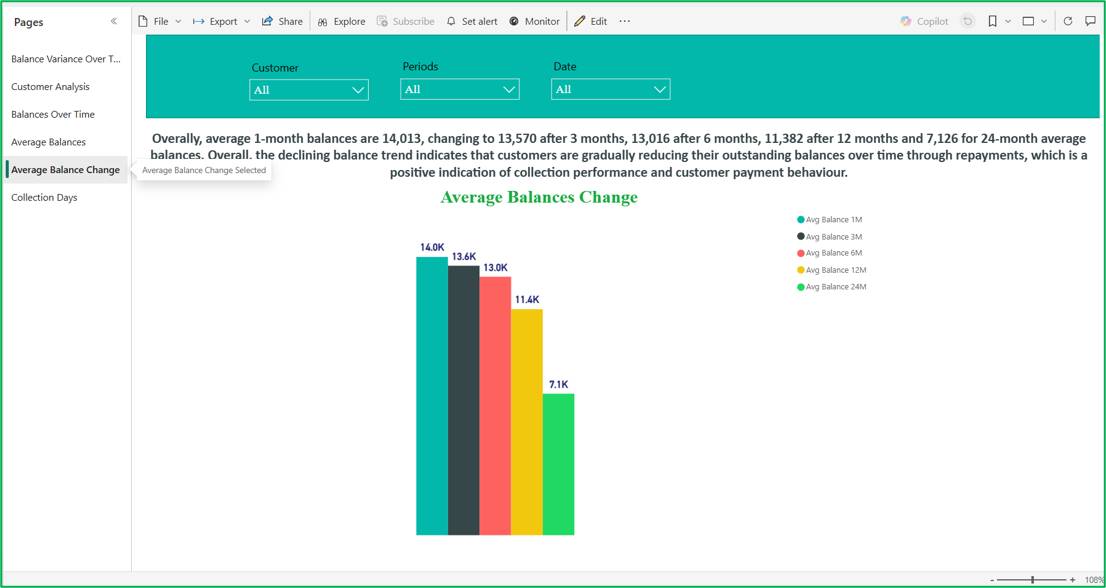
Figure 5 — Average Balance Change
This page reports unpaid invoices, overdue unpaid invoices, the number of customers with unpaid invoices, and two-timing measures: average days to first payment and average days to fully paid. Charts show average days to pay and days sales outstanding (DSO) over the 1, 3, 6, 12 and 24-month windows.
What it tells you: how long your cash really takes to arrive, and which customers are slow to pay.
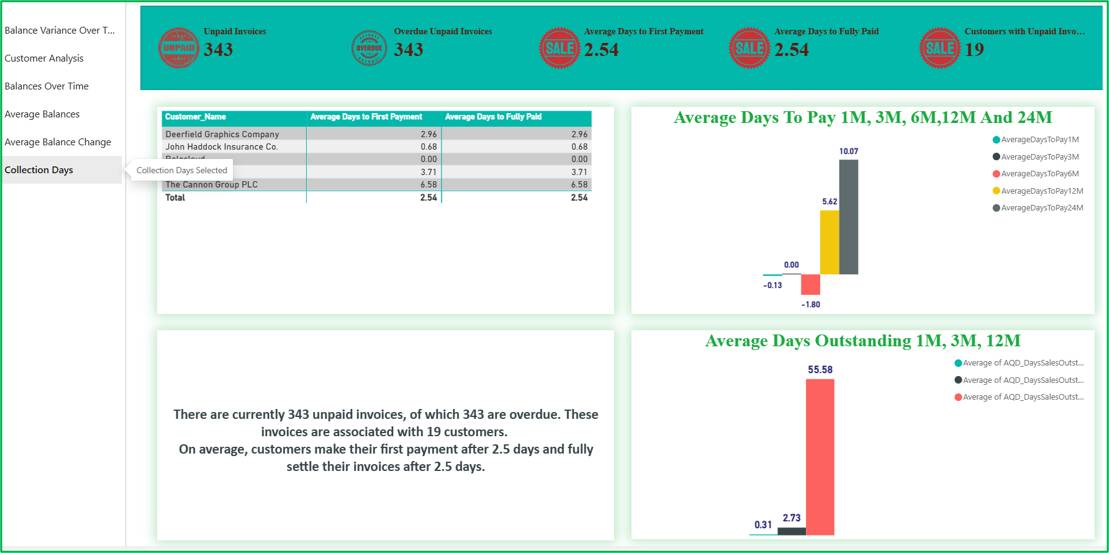
Figure 6 — Collection Days
Customer Rating gives every account a simple label, so you do not have to interpret five averages by eye. It works by checking how a customer's average balances step from one time window to the next:
| Rating | What it means |
| Excellent | The balance pattern is consistent across all four comparisons |
| Good | Consistent in three of four |
| Fair | Consistent in two of four |
| Weak | Consistent in only one |
| High Risk | No consistent pattern |
A customer with little or no history can also appear as High Risk, so treat a rating as a prompt to look closer, not as a verdict. Beyond the six pages, the underlying model also supports richer risk views, such as DSO health, customer health categories (Well-Performing, Watch, Bad / At-Risk) and collection-days trends, which can be added as the team's needs grow.
A report only helps if it changes behavior. Below is a simple rhythm that works for most finance teams.
Drill down before you act. Use the Customer filter to open an account across all pages before making a call or changing terms. A balance, a payment pattern and a collection speed together tell a much clearer story than anyone alone.
Mind the date filters. Overdue and day-past-due figures are measured against today's date, so they will move daily regardless of the period you select. Use them for current action and use the date slicers for historical trend analysis.
Keep the data fresh. The report is only as current as the receivable’s snapshots and ledger entries behind it. Agree with a refresh schedule that matches how often your team reviews it.
Validate the basics once. When first adopting the report, spot-check a few customers against your ledger. Confirm that payments are linked to the right invoices, because that drives the paid and unpaid status and the collection-days figures. Also confirm how the average balance trend is interpreted, so your team reads the ratings and narrative summaries consistently.
Cash flow problems rarely arrive suddenly. They build up slower payments, growing balances and customers who drift from reliable to risky over months. The Customer Receivables Analytics report makes that drift visible early, when it is still cheap to fix.
With one shared view of balances, payment behavior and collection speed, finance can work the right accounts first, and leadership can make credit and cash decisions on evidence instead of instinct.
The report is only as good as the receivables data behind it. Acumens Receivables & Collections Management produces this data directly within Business Central, where your invoices, payments and customer transactions are managed.