Both Aged Accounts Payable (Excel) and Aged Accounts Receivable (Excel) reports were reviewed to address the issue where changing the Period Count parameter did not dynamically change the aging period columns in the Excel output.
The report parameter was being applied to the underlying aging calculation, but the Excel layout itself did not dynamically generate columns based on the selected number of periods.
This issue has been resolved in Acumens Starter-pack app to allow the Excel output to dynamically generate the required aging period columns based on the Period Count selected by the user.
The functionality was validated with the following scenarios:
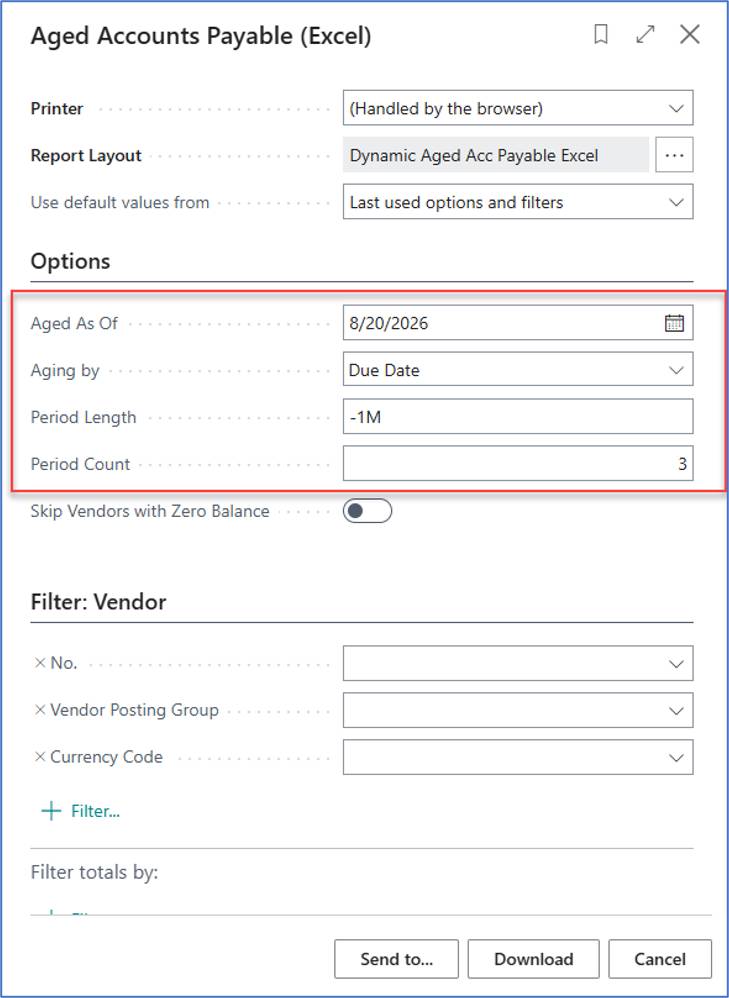
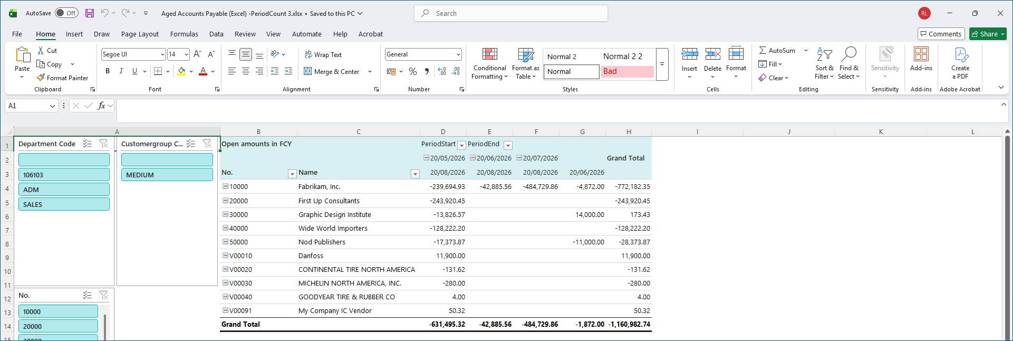
Period Count = 3: Excel generates 3 aging periods.
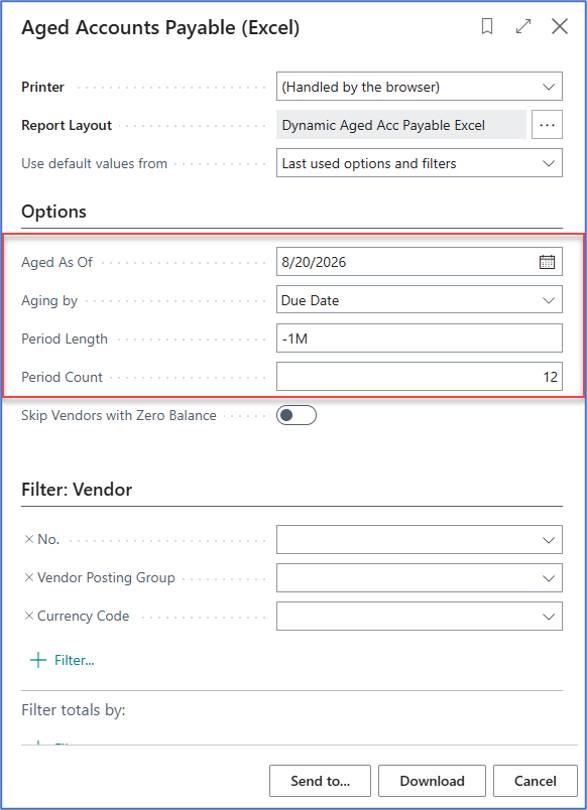
Period Count = 12: Excel dynamically generates 12 aging periods.
Period Count = 0: The system follows Microsoft's standard behavior and defaults to 5 aging periods.
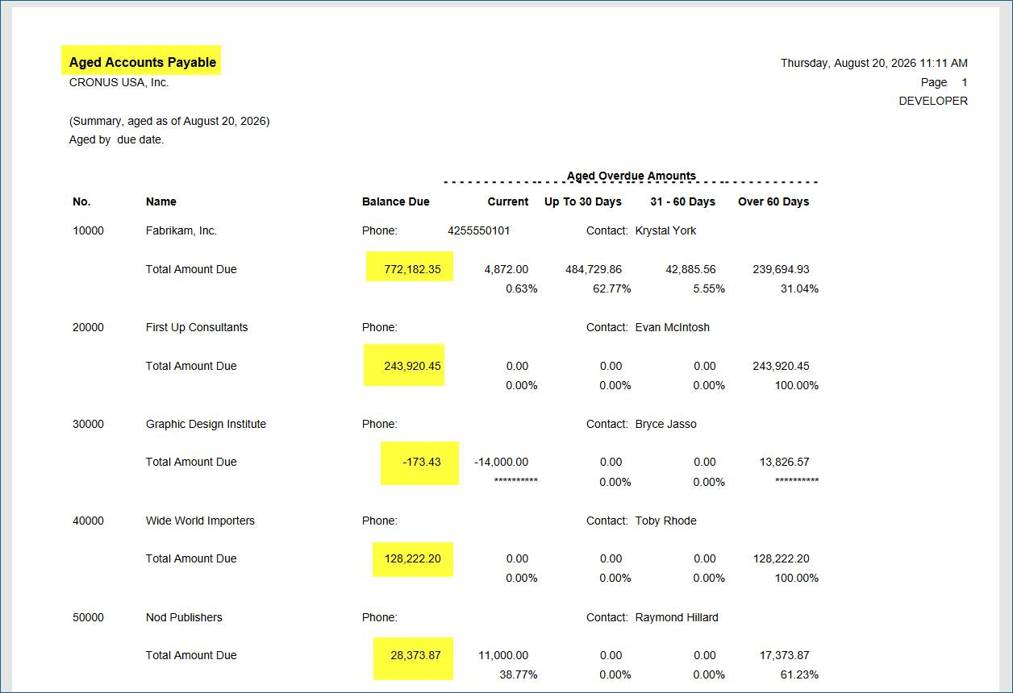
Data validation: Payables balances were reconciled against the standard AP aging report, and the totals were confirmed to match.
The custom dynamic Excel layout now correctly reflects the selected Period Count, providing a flexible aging analysis while maintaining consistency with both the AP and AR reports totals.
The following report parameters are provided.
Excel Output
Excel generates 3 aging periods as shown.
The following report parameters are provided.
Excel Output
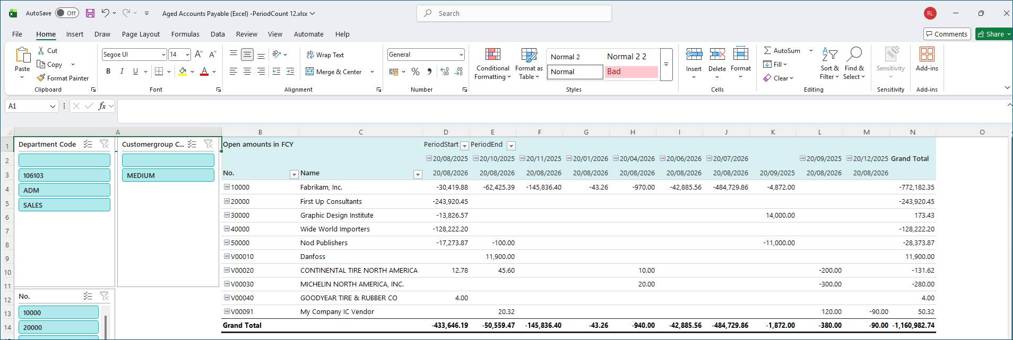
Excel generates 12 aging periods as shown.
The following report parameters are provided.
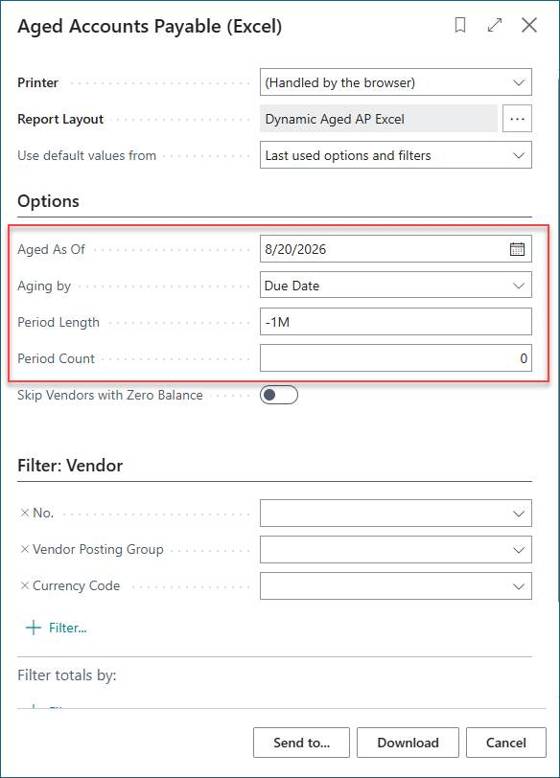
Microsoft intended 0 period count to default of 5 periods.
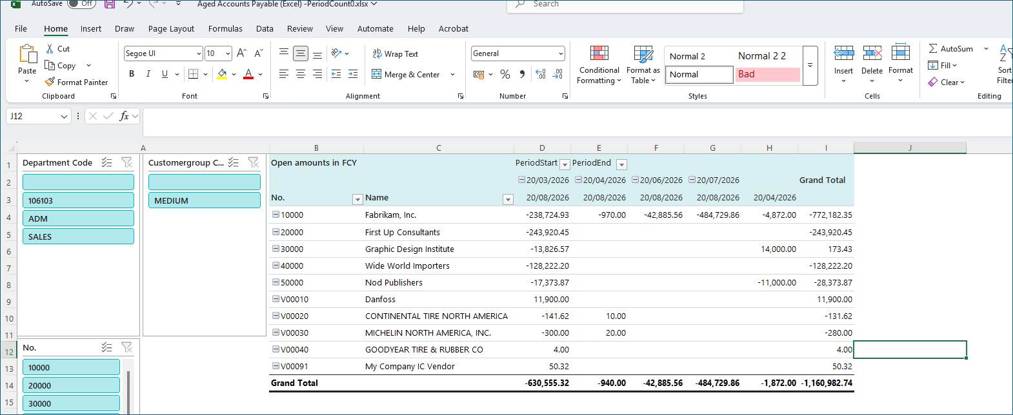
Excel Output
Excel generates 5 aging periods as shown.
Aged Accounts Payable Report.
Standard AP aging report and the totals were confirmed to match as shown below.